Coefficient of variation as a proxy for institutional scribal control
Paper section: Results §3.1 · Notebooks:2.1, 2.2, 2.3
Overview
Beyond the directional shift in median h/w ratios, a second signal is encoded in the dispersion of those ratios: how tightly tablets in a period cluster around their period median. Eerkens & Bettinger (2001) proposed that artifact Coefficient of Variation (CV) below ~17% indicates motor-skill limits (standardization by habit), while higher CV indicates less-constrained production. We use CV as a proxy for the degree of institutional control over scribal format.
The Coefficient of Variation
For a period with median h/w ratio \(\tilde{r}\) and standard deviation \(\sigma\):
Table 1: Standardization ranking of all periods by Coefficient of Variation (ascending = most standardized). Bold rows are the three benchmark periods discussed in the paper.
(a) CV standardization ranking — ascending order
Rank
Period
n
Median h/w
CV (%)
Orientation
0
1
Ur III
22,504
1.125000
25.100000
portrait
1
2
Early Old Babylonian
2,560
1.268000
27.400000
portrait
2
3
Proto-Elamite
1,457
1.333000
27.900000
portrait
3
4
Uruk IV
1,808
1.276000
31.900000
portrait
4
5
Old Akkadian
3,397
1.280000
32.100000
portrait
5
6
Old Babylonian
15,884
1.282000
34.200000
portrait
6
7
ED IIIb
1,895
1.033000
36.300000
portrait
7
8
ED IIIa
414
1.559000
40.600000
portrait
8
9
Hellenistic
453
0.900000
41.200000
landscape
9
10
Middle Babylonian
3,023
1.000000
46.000000
landscape
10
11
Middle Assyrian
1,056
1.110000
50.000000
portrait
11
12
Uruk III
4,985
1.192000
50.200000
portrait
12
13
Hittite
161
1.000000
50.500000
landscape
13
14
ED I-II
457
1.733000
51.900000
portrait
14
15
Old Assyrian
1,124
1.106000
53.600000
portrait
15
16
Neo-Assyrian
3,379
1.158000
53.900000
portrait
16
17
Ebla
3,229
1.026000
56.900000
portrait
17
18
Lagash II
274
1.305000
60.500000
portrait
18
19
Middle Elamite
601
0.863000
74.000000
landscape
19
20
Achaemenid
1,718
0.786000
78.500000
landscape
20
21
Neo-Babylonian
7,133
0.741000
80.700000
landscape
Three benchmark periods
The standardization landscape is anchored by three historically significant periods:
Period
Median h/w
CV
Interpretation
Ur III
1.125
25.1%
Tightest portrait norm — bureaucratic mass production
Achaemenid
0.786
78.5%
Widest overall, but pixel IQR = 0.150 (tight central tendency)
Neo-Babylonian
0.741
80.7%
Loosest dispersion — diverse archive genres
The apparent paradox of Achaemenid high CV alongside tight pixel IQR is resolved by distinguishing two kinds of standardization:
Orientation standardization: the central mass of tablets clusters tightly around the landscape norm (IQR = 0.150), suggesting the landscape format was institutionally enforced for canonical documents
Global shape standardization: a tail of outlier formats expands the overall CV — likely non-canonical genres (astronomical diaries, school texts, ritual tablets) that did not conform to the administrative format
The standardization curve
Code
import pandas as pd, matplotlib.pyplot as plt, numpy as npdf = pd.read_csv("../../paper/figures/period_summary_stats.csv")chron_order = ['Uruk IV','Uruk III','Proto-Elamite','ED I-II','ED IIIa','ED IIIb','Ebla','Old Akkadian','Lagash II','Ur III','Early Old Babylonian','Old Babylonian','Old Assyrian','Middle Assyrian','Middle Babylonian','Middle Elamite','Hittite','Neo-Assyrian','Neo-Babylonian','Achaemenid','Hellenistic']df['_rank'] = df['Period'].map({p: i for i, p inenumerate(chron_order)})df = df.sort_values('_rank').dropna(subset=['_rank'])fig, ax = plt.subplots(figsize=(10, 4))colors = ['#b5622e'if p in ['Ur III', 'Neo-Babylonian', 'Achaemenid'] else'#4a6fa5'for p in df['Period']]ax.bar(range(len(df)), df['CV'] *100, color=colors, alpha=0.85, edgecolor='white', lw=0.5)ax.set_xticks(range(len(df)))ax.set_xticklabels(df['Period'], rotation=45, ha='right', fontsize=7.5)ax.axhline(17, color='grey', ls='--', lw=1.2, alpha=0.7, label='Eerkens & Bettinger (2001) motor-skill threshold (17%)')ax.set_ylabel('CV of h/w ratio (%)', fontsize=9)ax.set_title('Scribal standardization by period — lower CV = tighter institutional control', fontsize=10)ax.legend(fontsize=8)plt.tight_layout()plt.show()
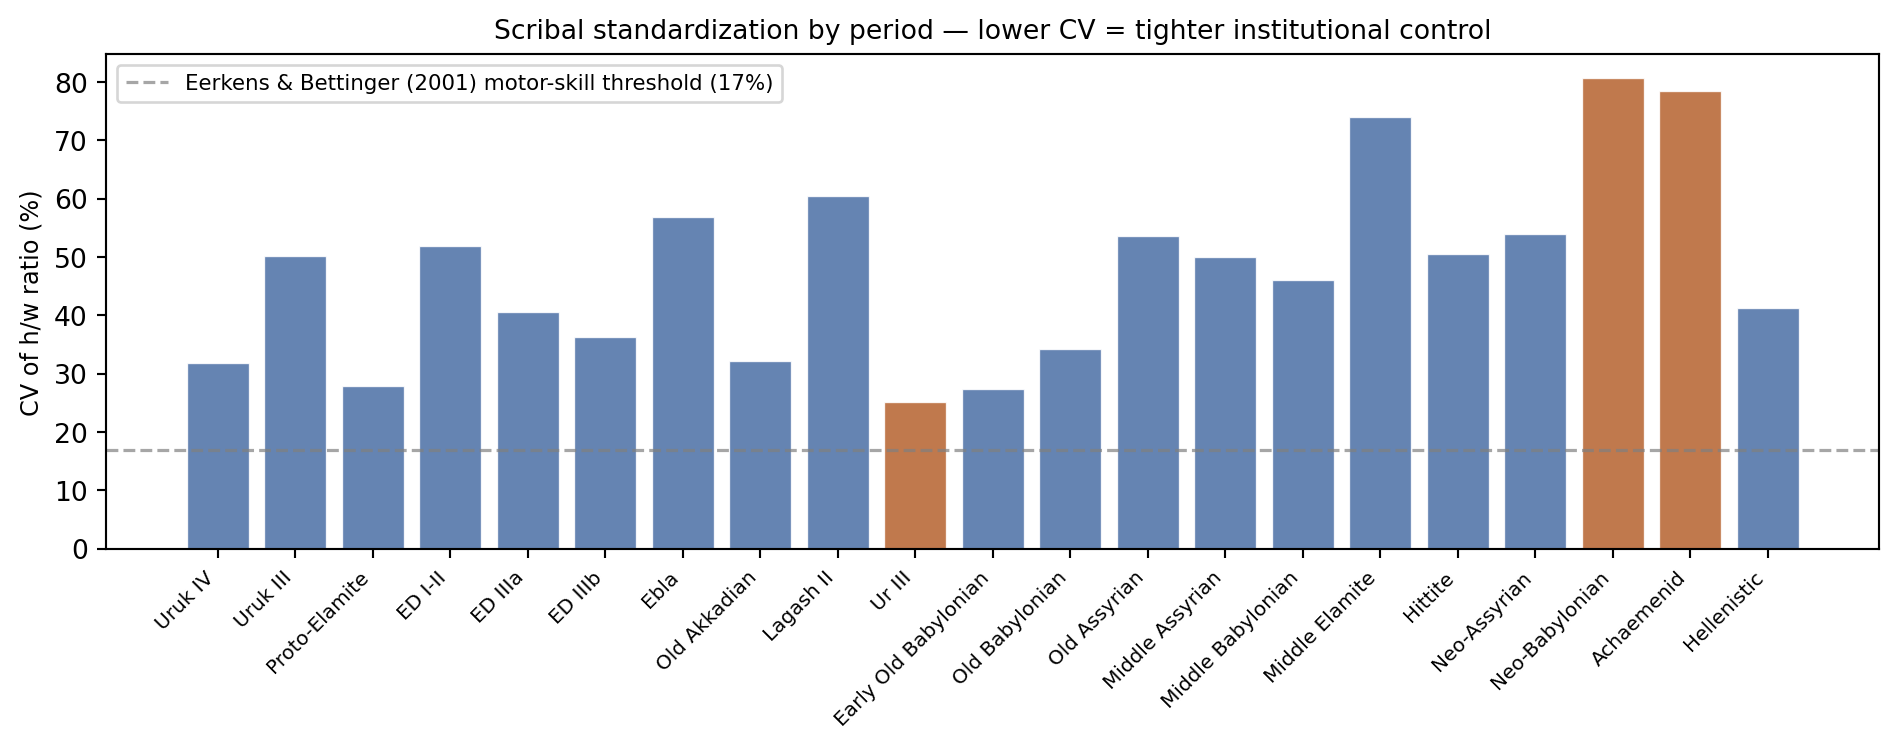
Figure 1: CV of h/w ratio by period, sorted chronologically. High CV = low scribal control over format; low CV = tight institutional standard.
Eerkens & Bettinger framework
Eerkens & Bettinger (2001) proposed that artifact CV ≤ 17% signals production under cognitive templates — mental representations of a target form that constrain production even without measurement tools. CV 17–57% indicates reduced copying fidelity; above 57%, variation is essentially unconstrained.
Applied to tablet morphology:
No period reaches the 17% threshold, confirming that scribal shape was always more variable than true standardized craft production (e.g., mass-produced ceramics)
Ur III (25.1%) comes closest — consistent with the interpretation of Ur III as the most bureaucratically controlled period of cuneiform writing
Neo-Babylonian (80.7%) and Achaemenid (78.5%) fall in the “unconstrained” range globally, but the Achaemenid pixel IQR signal suggests local standardization within the dominant genre
George’s (2010) concept of “fixed balance” — scribal templates for geometrically harmonious proportions — complements this framework: the portrait norms of the 3rd and early 2nd millennium (h/w ≈ 1.1–1.3) and landscape norms of the 1st millennium (h/w ≈ 0.75–0.85) represent two successive cognitive templates, each maintained with varying institutional force.
Note
Next:Period Classification → — how well machine learning models recover historical periods from silhouette shape alone.
Source Code
---title: "2 · Standardization Scale"subtitle: "Coefficient of variation as a proxy for institutional scribal control"sidebar: analyses---> **Paper section:** Results §3.1 · **Notebooks:** `2.1`, `2.2`, `2.3`## OverviewBeyond the directional shift in median h/w ratios, a second signal is encoded in the**dispersion** of those ratios: how tightly tablets in a period cluster around theirperiod median. Eerkens & Bettinger (2001) proposed that artifact Coefficient ofVariation (CV) below ~17% indicates motor-skill limits (standardization by habit),while higher CV indicates less-constrained production. We use CV as a proxy for thedegree of institutional control over scribal format.## The Coefficient of VariationFor a period with median h/w ratio $\tilde{r}$ and standard deviation $\sigma$:$$\text{CV} = \frac{\sigma}{\bar{r}} \times 100\%$$where $\bar{r}$ is the mean ratio. Lower CV = tighter clustering around the periodnorm = stronger scribal standardization.## Period standardization ranking```{python}#| label: tbl-cv-rank#| tbl-cap: "Standardization ranking of all periods by Coefficient of Variation (ascending = most standardized). Bold rows are the three benchmark periods discussed in the paper."import pandas as pddf = pd.read_csv("../../paper/figures/period_summary_stats.csv")df_sorted = df.sort_values('CV').reset_index(drop=True)df_sorted['Rank'] =range(1, len(df_sorted) +1)df_sorted['CV_pct'] = (df_sorted['CV'] *100).round(1)df_sorted['Median'] = df_sorted['Median'].round(3)display_cols = ['Rank', 'Period', 'n', 'Median', 'CV_pct', 'Orientation']df_display = df_sorted[display_cols].copy()df_display.columns = ['Rank', 'Period', 'n', 'Median h/w', 'CV (%)', 'Orientation']highlight = ['Ur III', 'Neo-Babylonian', 'Achaemenid']def highlight_rows(row):if row['Period'] in highlight:return ['font-weight: bold; background-color: #fff3e0'] *len(row)return [''] *len(row)df_display.style \ .apply(highlight_rows, axis=1) \ .background_gradient(subset=['CV (%)'], cmap='YlOrRd') \ .format({'n': '{:,}'}) \ .set_caption("CV standardization ranking — ascending order")```## Three benchmark periodsThe standardization landscape is anchored by three historically significant periods:| Period | Median h/w | CV | Interpretation ||---|---|---|---|| **Ur III** | 1.125 | 25.1% | Tightest portrait norm — bureaucratic mass production || **Achaemenid** | 0.786 | 78.5% | Widest overall, but pixel IQR = 0.150 (tight central tendency) || **Neo-Babylonian** | 0.741 | 80.7% | Loosest dispersion — diverse archive genres |The apparent paradox of Achaemenid high CV alongside tight pixel IQR is resolved bydistinguishing two kinds of standardization:- **Orientation standardization**: the central mass of tablets clusters tightly around the landscape norm (IQR = 0.150), suggesting the landscape format was institutionally enforced for canonical documents- **Global shape standardization**: a tail of outlier formats expands the overall CV — likely non-canonical genres (astronomical diaries, school texts, ritual tablets) that did not conform to the administrative format## The standardization curve```{python}#| label: fig-cv-diachronic#| fig-cap: "CV of h/w ratio by period, sorted chronologically. High CV = low scribal control over format; low CV = tight institutional standard."import pandas as pd, matplotlib.pyplot as plt, numpy as npdf = pd.read_csv("../../paper/figures/period_summary_stats.csv")chron_order = ['Uruk IV','Uruk III','Proto-Elamite','ED I-II','ED IIIa','ED IIIb','Ebla','Old Akkadian','Lagash II','Ur III','Early Old Babylonian','Old Babylonian','Old Assyrian','Middle Assyrian','Middle Babylonian','Middle Elamite','Hittite','Neo-Assyrian','Neo-Babylonian','Achaemenid','Hellenistic']df['_rank'] = df['Period'].map({p: i for i, p inenumerate(chron_order)})df = df.sort_values('_rank').dropna(subset=['_rank'])fig, ax = plt.subplots(figsize=(10, 4))colors = ['#b5622e'if p in ['Ur III', 'Neo-Babylonian', 'Achaemenid'] else'#4a6fa5'for p in df['Period']]ax.bar(range(len(df)), df['CV'] *100, color=colors, alpha=0.85, edgecolor='white', lw=0.5)ax.set_xticks(range(len(df)))ax.set_xticklabels(df['Period'], rotation=45, ha='right', fontsize=7.5)ax.axhline(17, color='grey', ls='--', lw=1.2, alpha=0.7, label='Eerkens & Bettinger (2001) motor-skill threshold (17%)')ax.set_ylabel('CV of h/w ratio (%)', fontsize=9)ax.set_title('Scribal standardization by period — lower CV = tighter institutional control', fontsize=10)ax.legend(fontsize=8)plt.tight_layout()plt.show()```## Eerkens & Bettinger frameworkEerkens & Bettinger (2001) proposed that artifact CV ≤ 17% signals production under**cognitive templates** — mental representations of a target form that constrainproduction even without measurement tools. CV 17–57% indicates reduced copyingfidelity; above 57%, variation is essentially unconstrained.Applied to tablet morphology:- **No period reaches the 17% threshold**, confirming that scribal shape was always more variable than true standardized craft production (e.g., mass-produced ceramics)- **Ur III (25.1%)** comes closest — consistent with the interpretation of Ur III as the most bureaucratically controlled period of cuneiform writing- **Neo-Babylonian (80.7%) and Achaemenid (78.5%)** fall in the "unconstrained" range globally, but the Achaemenid pixel IQR signal suggests local standardization within the dominant genreGeorge's (2010) concept of **"fixed balance"** — scribal templates for geometricallyharmonious proportions — complements this framework: the portrait norms of the 3rdand early 2nd millennium (h/w ≈ 1.1–1.3) and landscape norms of the 1st millennium(h/w ≈ 0.75–0.85) represent two successive cognitive templates, each maintained withvarying institutional force.::: {.callout-note}**Next:** [Period Classification →](03-classification.qmd) — how well machine learningmodels recover historical periods from silhouette shape alone.:::